← Back to ProjectsPG&E / PROCESS INTELLIGENCE / SUMMER 2026
Bayesian Network Risk Intelligence Platform
A decision-support platform that uses Bayesian inference, causal analysis, and automated scenario generation to explore outage risk and identify the variables that most strongly influence modeled outcomes.
PythonFlaskpandaspgmpyBayesian NetworksCausal Inference
* PROJECT DATA AND OPERATIONAL TERMINOLOGY HAVE BEEN ANONYMIZED TO PROTECT CONFIDENTIAL INFORMATION.
The Problem
Outage data contains many interacting conditions, making it difficult to understand which combinations are associated with elevated risk and which variables may actually influence an outcome. Static reporting alone cannot easily answer those questions.
The Goal
Extend an existing Bayesian Network into a system that could dynamically generate scenarios, run probabilistic and causal analyses, rank outcomes, and present the results through a decision-support dashboard.
MY ROLE
Risk modeling, backend development, and decision-support design
I worked across the analysis pipeline and dashboard experience, integrating a trained Bayesian Network into a Flask application, developing scenario-generation workflows, executing observational and intervention-based analyses, ranking results, and translating model outputs into a more usable risk-intelligence interface.
SYSTEM ARCHITECTURE
Turning a trained model into a risk exploration pipeline
The project evolved beyond displaying precomputed results. I built a workflow that could generate scenarios from outage data, execute them through the Bayesian model and causal engine, aggregate results, rank risk, and surface those findings in the dashboard.
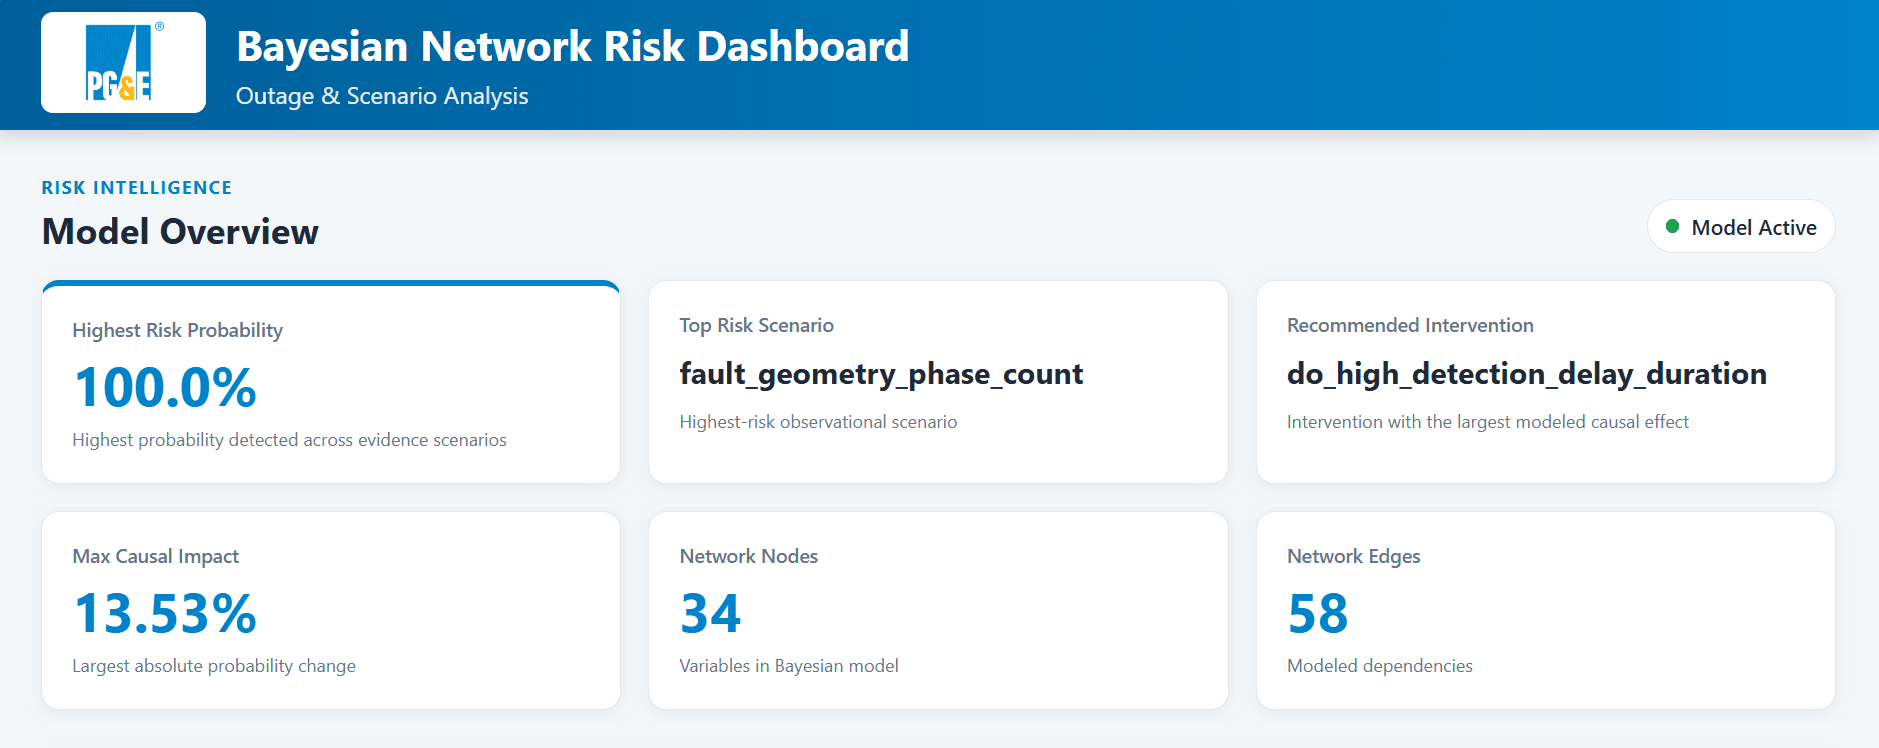
34 Nodes
Variables represented within the trained Bayesian Network.
58 Edges
Modeled dependencies connecting operational variables.
Dynamic Scenarios
Scenarios could be generated programmatically instead of relying only on manually authored inputs.
OBSERVATIONAL INFERENCE
What conditions are associated with elevated risk?
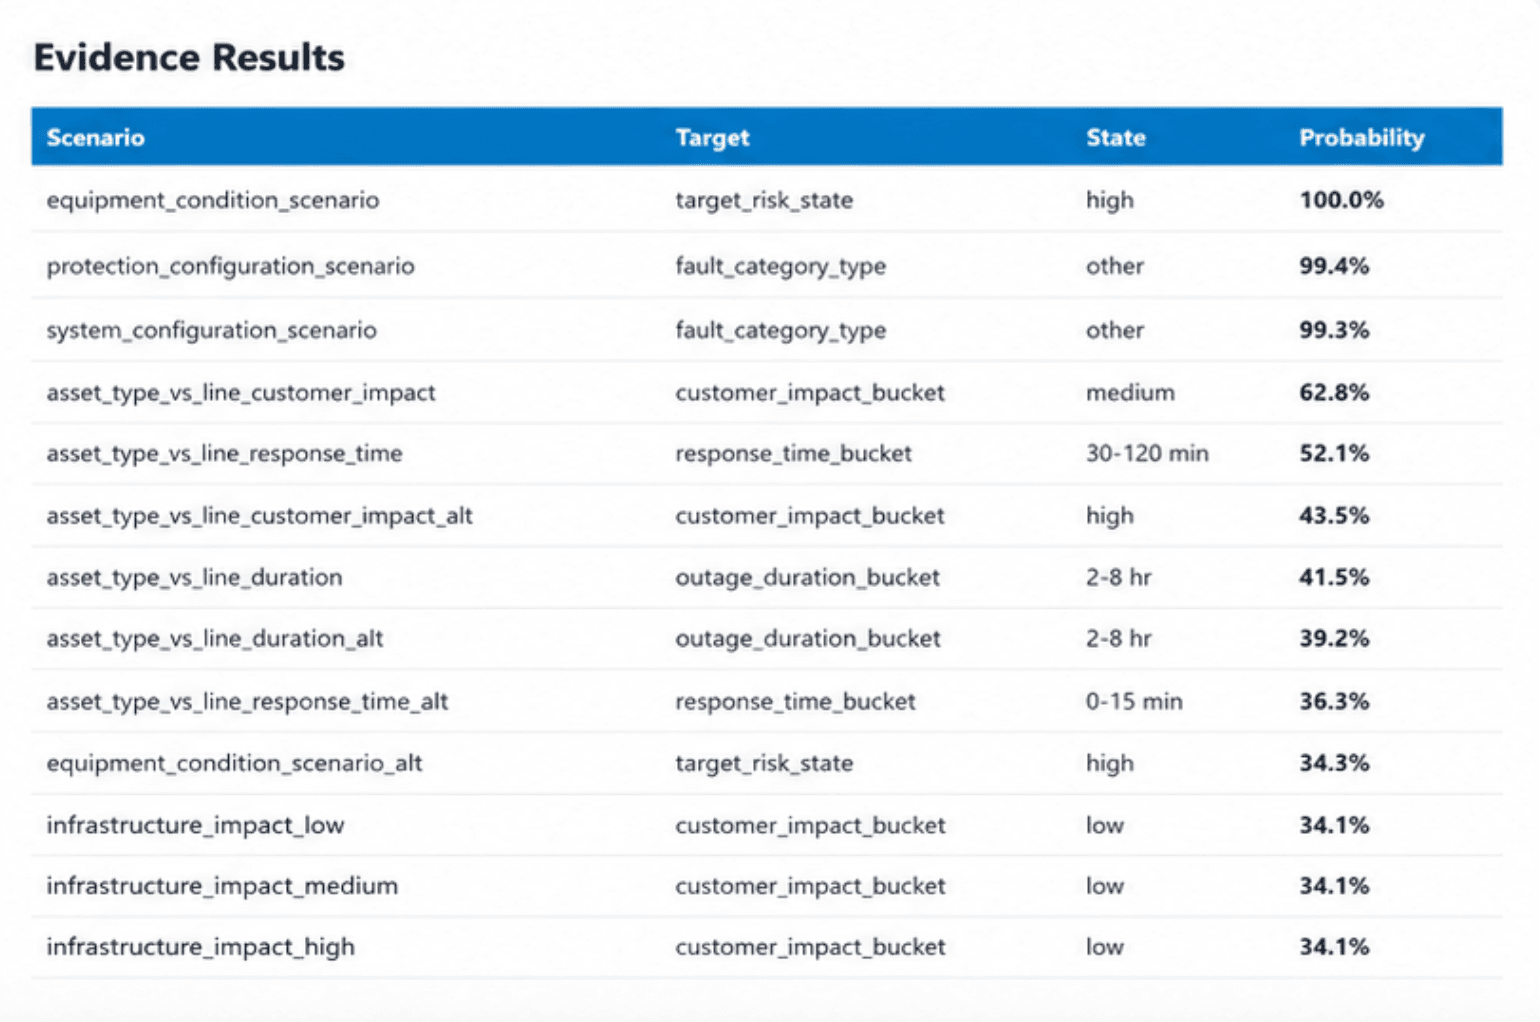
The first layer of analysis uses evidence-based Bayesian inference. Given observed scenario conditions, the system calculates posterior probabilities for target outcomes and ranks the strongest modeled risk scenarios.
Evidence ≠ Causation
A high posterior probability tells us that an outcome is strongly associated with a given set of evidence. It does not necessarily mean changing one of those variables will change the outcome.
Why Ranking Matters
Batch execution produces many probability outputs. Ranking them transforms raw inference results into a shortlist of scenarios worth deeper investigation.
CAUSAL ANALYSIS
What happens if we intervene?
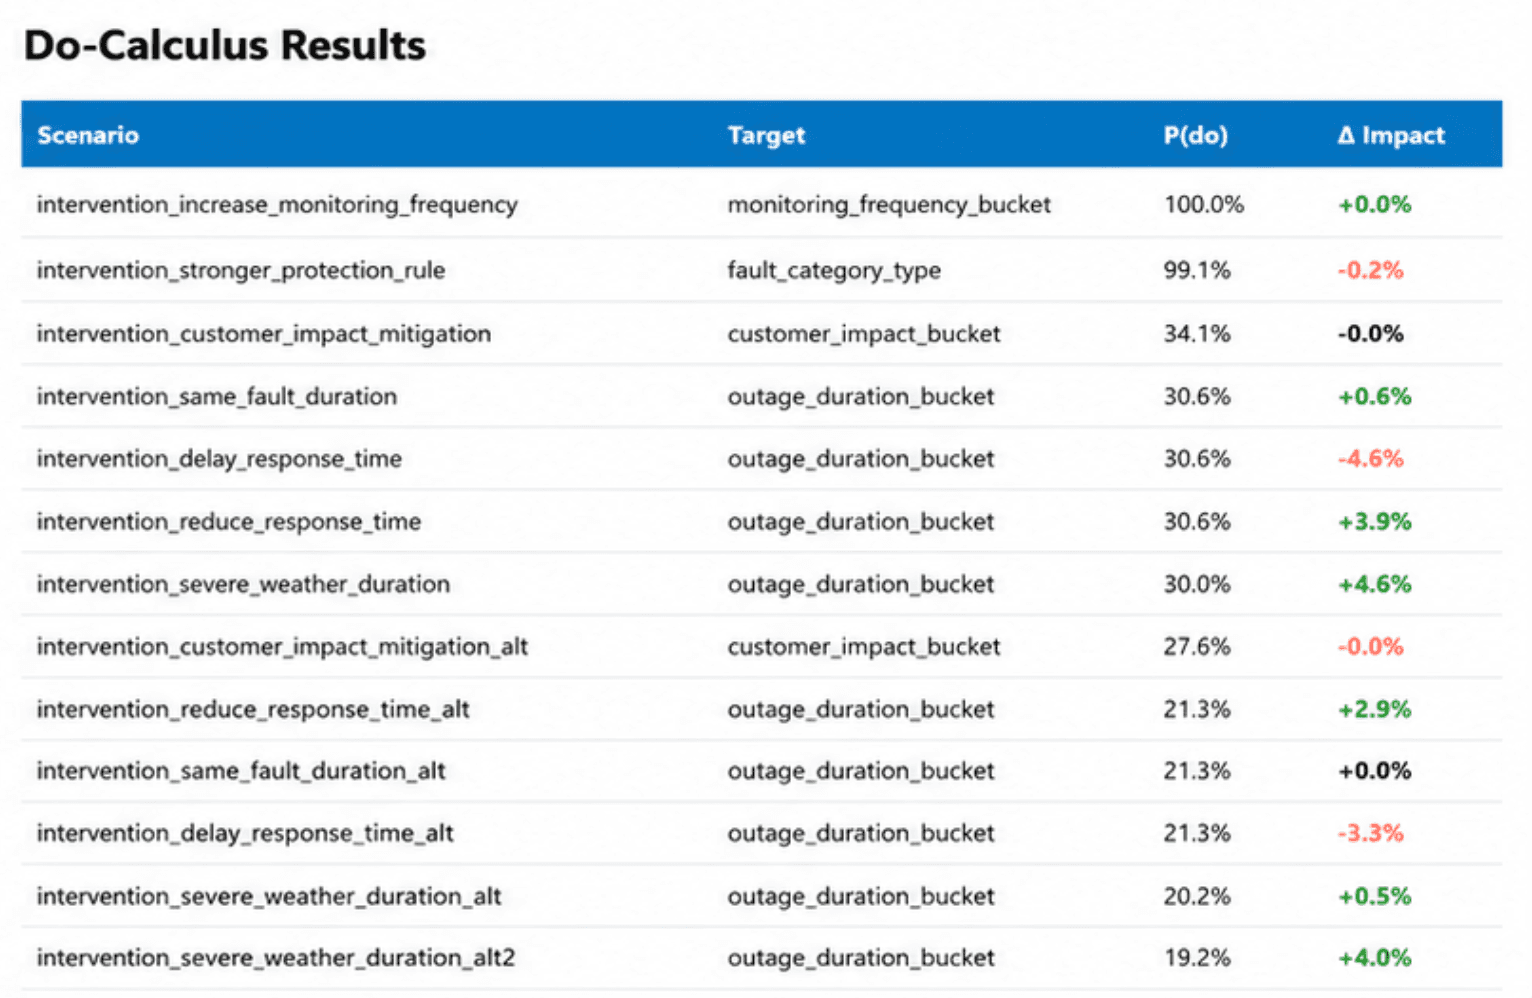
To move beyond correlation, the platform also evaluates intervention scenarios using a custom causal engine. Rather than asking only what is likely given evidence, the model can estimate how target probabilities change under a modeled intervention.
P(do)
The modeled probability of an outcome after applying an intervention to a variable.
Observed vs. Intervened
Comparing observational and intervention probabilities helps distinguish variables that are simply associated with an outcome from those that may have causal influence.
Impact Ranking
Absolute probability change provides a way to rank candidate interventions by their modeled effect.
KEY TECHNICAL DISCOVERY
A plausible intervention turned out not to be a causal driver
Early scenario generation focused heavily on response-time variables. The intervention results, however, showed unexpectedly small changes in modeled duration risk.
Instead of treating that as a modeling failure, I investigated the structure of the Bayesian Network itself. The variable had no directed path to the modeled duration outcome, which explained why manipulating it produced little causal effect.
ITERATION
Letting the graph structure change the analysis
1. Inspect the Network
I traced graph relationships around the modeled duration target rather than continuing to generate scenarios from assumptions alone.
2. Identify Direct Drivers
Network inspection surfaced the variables that directly feed into the duration outcome and were therefore stronger candidates for intervention analysis.
3. Regenerate Scenarios
I redesigned scenario generation around those direct drivers and reran the analysis pipeline using combinations grounded in the actual model structure.
DECISION SUPPORT
Translating model outputs into something usable
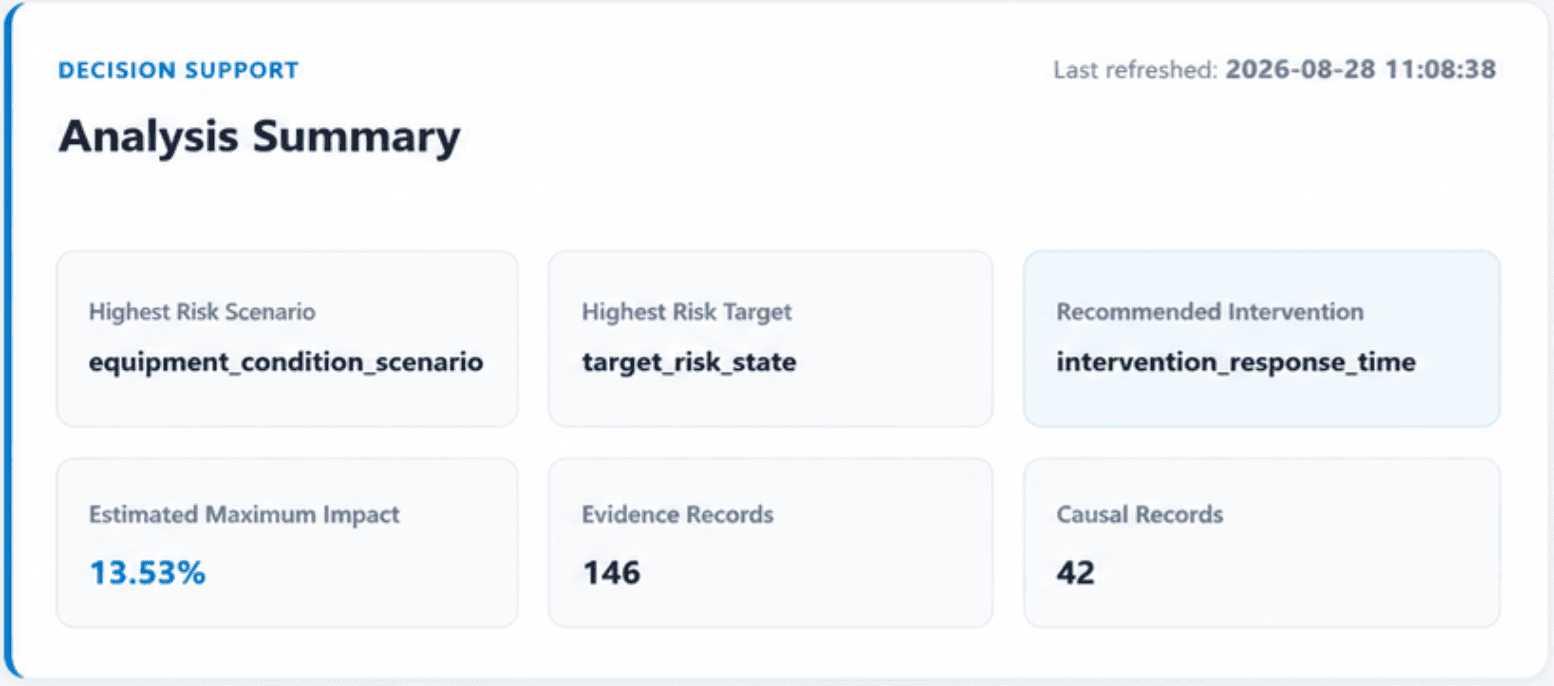
The dashboard summarizes the analytical pipeline into a small number of high-value signals: highest-risk scenario, corresponding target, recommended modeled intervention, maximum impact, and the amount of evidence and causal analysis available.
The goal was not to expose every model output at once. Instead, the interface creates a decision-support layer that helps users move from hundreds of analysis rows toward the scenarios and interventions that deserve attention first.
ENGINEERING MILESTONES
From static dashboard to analysis platform
Model Integration
Loaded the trained Bayesian Network into the application and validated probabilistic inference through pgmpy.
Scenario Generation
Built workflows for converting outage data into Bayesian-compatible scenario combinations automatically.
Batch Execution
Automated execution of scenario sets through the inference and causal-analysis pipeline instead of evaluating scenarios one at a time.
Risk & Causal Ranking
Aggregated model outputs into ranked scenario and intervention results based on probability and modeled impact.
Network Investigation
Added structural analysis to determine whether candidate intervention variables actually had paths to target outcomes.
Decision-Support UI
Built a Flask dashboard that converts model outputs into summarized risk intelligence for easier interpretation.
KEY TAKEAWAY
A model output is only useful if you understand why the model produced it
One of my biggest takeaways from the project was that building analytics infrastructure is only part of the work. When an intervention produced an unexpected result, understanding the network structure became more valuable than simply generating more output.
The project ultimately shifted from displaying probabilities to investigating how the model reasons, which variables actually influence an outcome, and how those insights can be surfaced in a form that supports better decisions.